VIRUSES & SEQUENCES
RODENTS INFORMATION
MISCELLANEOUS
VIRUSES & SEQUENCES
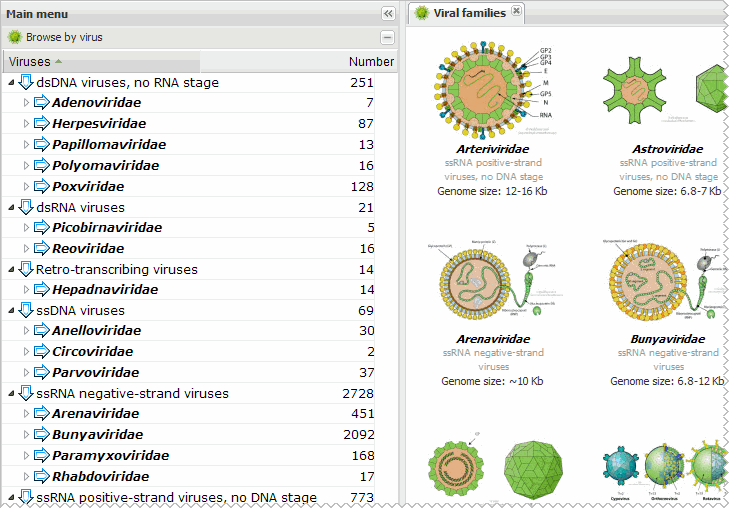
There are two ways as following: (i) click the 'Browse' menu on the top of the Home page, or (ii) click the 'Browse by virus' submenu title in the menu panel on the left side of the window to expand (not collapse) the submenu. This will bring a new Tab in the main content panel with information of known rodent-associated viruses families (genome type, average size) and illustrates of virons (available from ViralZone). Direct links to the respective page in ViralZone website is also provided for further information.
| ||
 |
Each line in the main table is expandable by single click the leading '+' icon or double-click the line itself. For easy visualizing the genome organization of the virus, a colorful linear map is offered for each COMPLETE viral sequence. Click the linear map will pop up a window within the webpage showing the linear map with detailed annotation information and direct links to individual records in GenBank.
 |
 |
If users are interested in one viral sequence shown in the information table and hope to find all sequences reported by the same work (publication), users can click the leading '+' icon or double-click the line itself to show the detailed information first. Then, users can single click the green plus icon followed the literature details to get a new Tab with all sequences reported in this publication.
 |
It may be difficult to load too many lines in a single page especially for visitors with poor network speed or limited CPU power. So to avoid potential overloading we set to show 100 sequences per page in the information table by default. Users can use the navigation tools on the bottom tool bar of the table to view next or any other page. The auto-paging setting can be turned off by single click the 'Paging off' button on the bottom tool bar of each table (click this button again to re-enable auto-paging).
 |
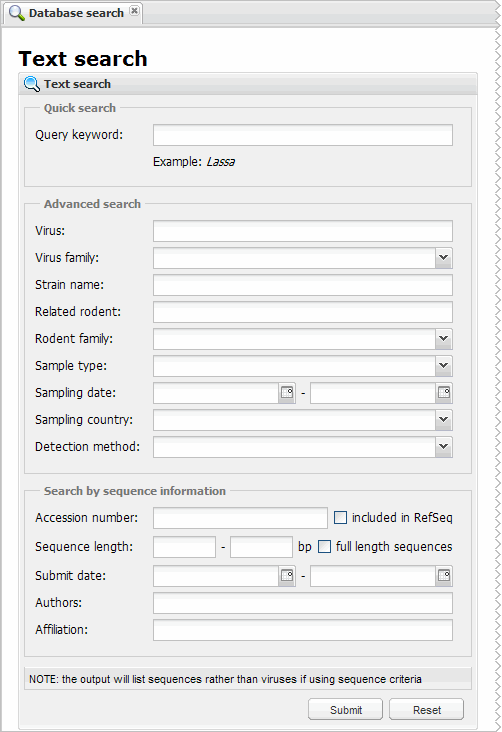
For advanced users, searching the database would be a more efficient way to find required information than browsing the database. So we provide a powerful text search engine in the search panel. To show the search panel, click the 'Search' menu on the top of the Home page or click the 'Search' button on the bottom toolbar of the menu panel on the left side of the window. For quick start, users can use the 'Quick search' form that contains a single entry. The 'Advanced search' form allows users to perform customized complex searches of all information in the database.
 |
For each information table, a 'Download sequence(s)' button is available on the bottom tool bar. Click the button will show a menu to allow users to save all sequences (in the current table view) or selected sequence (single click to select a line) into nucleotide/protein sequences in FASTA format.
 |
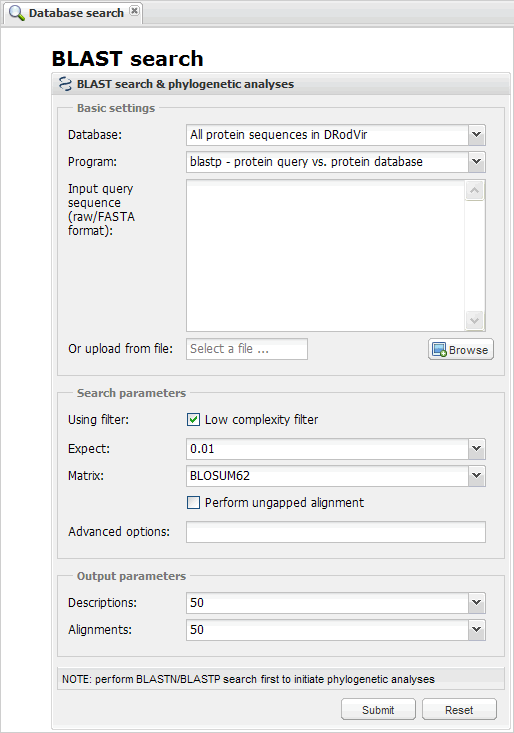
The BLAST submit form is in the same search panel as text search form aforementioned. So single click the 'Search' menu on the top of the Home page or click the 'Search' button on the bottom toolbar of the menu panel on the left side of the window to show the search Tab in the main content panel. The BLAST submit form is on the right side of the Text search form. Use the bottom horizonal slider if you can't see the full BLAST form. Please note that users can set to search in all sequences in DRodVir or only complete genomes using BLAST.
 |
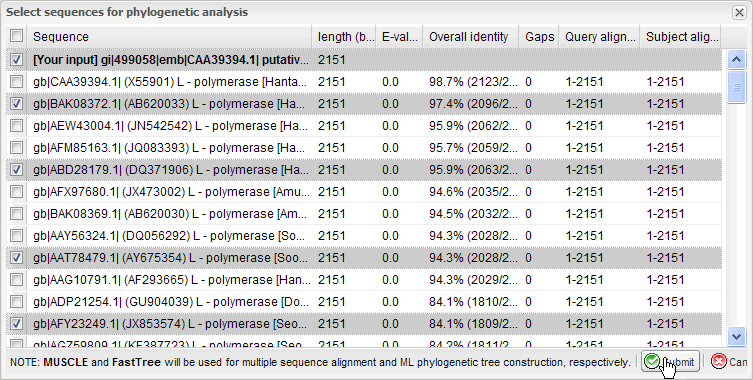
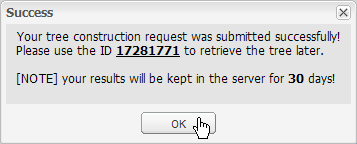
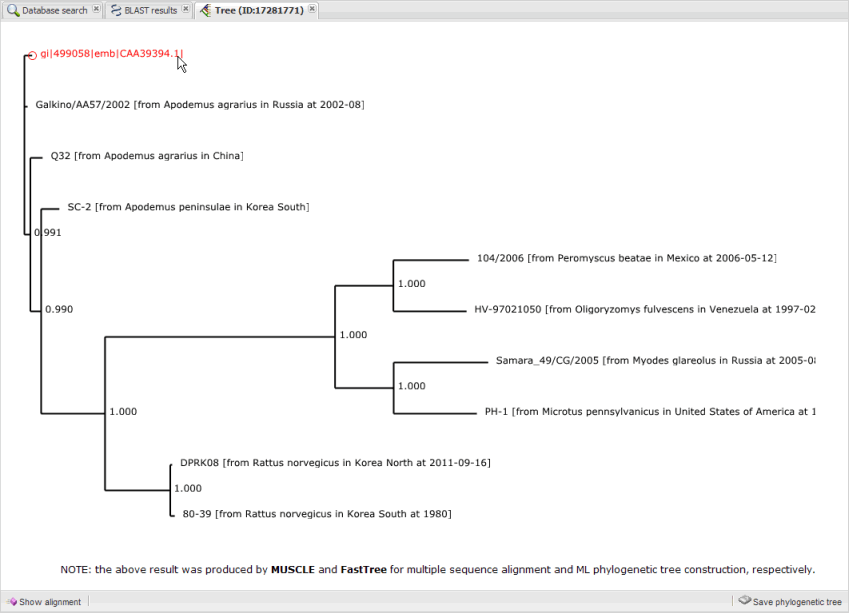
In order to make phylogenetic analyses users MUST perform BLASTN or BLASTP search (see above) first to determine which sequences in the database should be included. In the Tab of BLAST result a 'Phylogeny' button is given at the bottom right. Click the button will bring a pop up window to allow users to select sequences for follow-up phylogenetic analyses (note that the user input sequence for BLAST MUST be included). After user selections just submit the form and an integrated pipeline for multiple sequence alignment and tree construction will be processed in background. Users will have a message window with an ID (8-bit integer). Users can input the ID into the entry at the bottom left of the window and click the button to retrieve the tree later. Both multiple sequence alignment and phylogenetic tree can be saved as local files for further analyses.
 | ||
 | ||
 |
 | |
 | ||
RODENTS INFORMATION
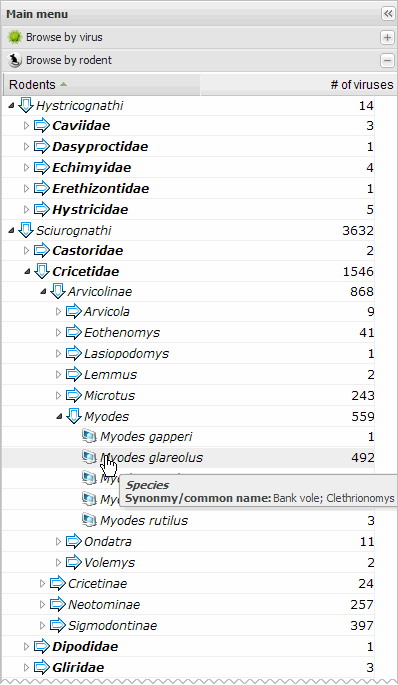
The left side menu panel is multifunctional, and contains a set of submenus. By default it shows the submenu that organizing all sequences in categories of viruses. In order to switch to the submenu that organizing all sequences in categories of rodents, click the 'Browse' menu on the top of the Home page first and then click the 'Browse by rodent' submenu title in the menu panel on the left side of the window to expand (not collapse) the submenu. For brevity, the taxonomic tree shows to only family level, but it can be further expanded to genus/species level by single click the branch of the tree.
|
 |
||||||
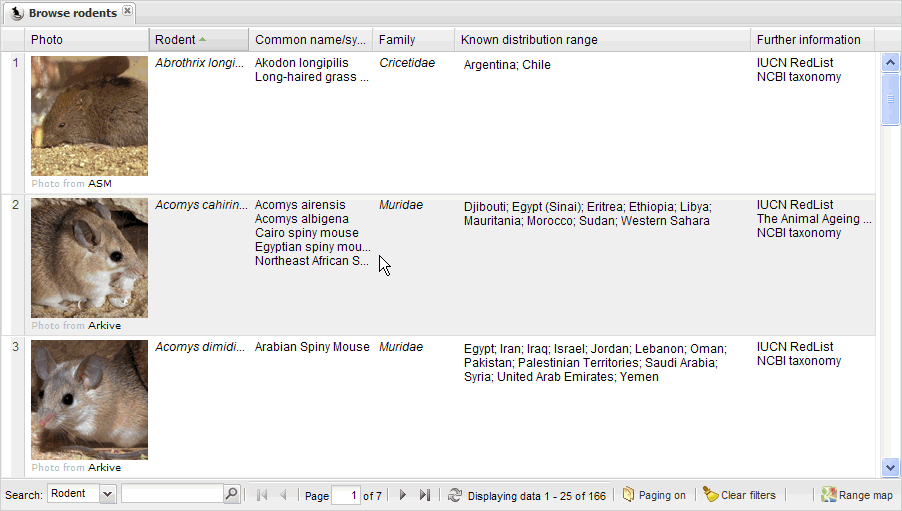
To bridge the gaps between virologists and zoologists the basic information of rodents such as species, common name, known distribution can be easily browsed when users choose to browse all viruses by rodent (see above), a 'Browse rodents' Tab is present in the right main content panel. Note that to avoid possible overloading of the client web browser, the information is displayed with 25 rodent species per page by default. For quick locating a certain rodent species, users can use the search entry at the bottom toolbar for searching by rodent name/distribution. Click the rodents name in the search results can also bring the Tab with all viruses identified in given species of rodent.
 |
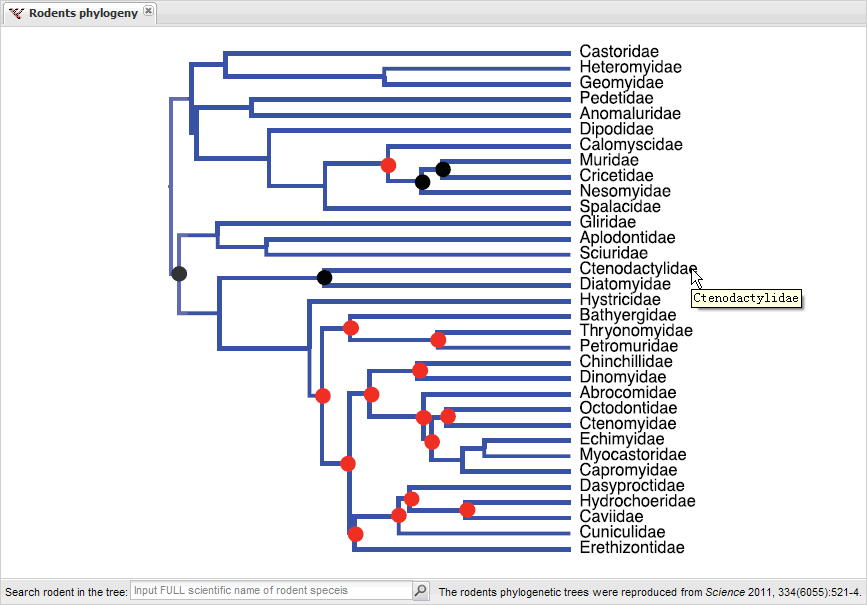
The phylogenetic relationships between different rodent families were retrieved from a previous study by Meredith et al (Science 2011, 334:521-4) and carefully integrated into the database. Users can click the 'Rodent phylogeny' on the bottom toolbar of the menu panel to open the rodents phylogeny Tab showing the rodent family tree in the main content panel. Or alternatively, when browse the rodents information (see above) users can click the tree icon shown below the rodents' family to show the tree directly with this rodent family underlined. Please note, the rodent family phylogenetic information is also searchable by using the search entry at the bottom toolbar of the rodents phylogeny Tab.
| ||
 |
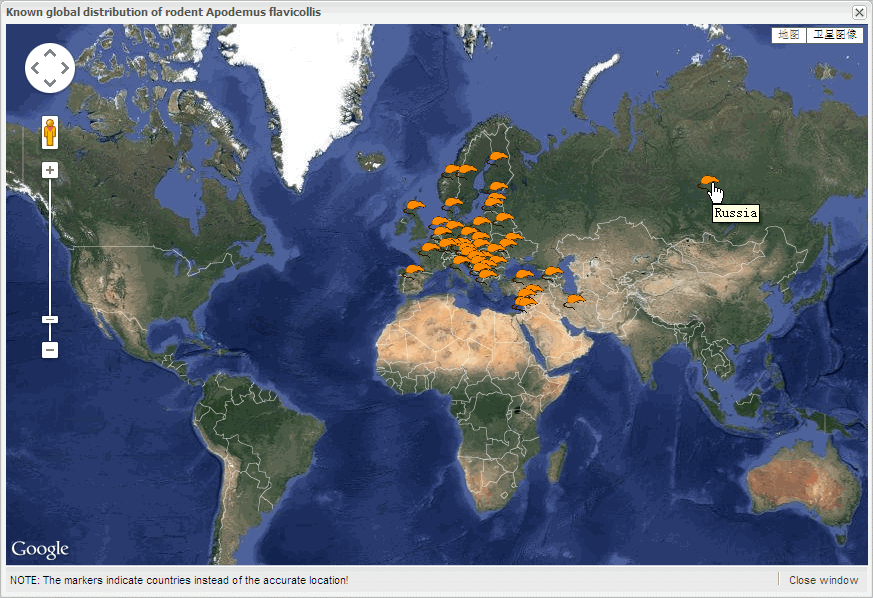
The known distribution range of each rodent species were collected from the ICUN RedList website and given in the rodent information Tab (see above). For an intuitive illustration users can click the 'Range map' button at the bottom right to view the Google map with the distributed countries marked. Please note that it shows the distribution of only ONE rodent species per time, so users need to select the interested rodent species (single click the line) before click the button.
 |
 |
MISCELLANEOUS
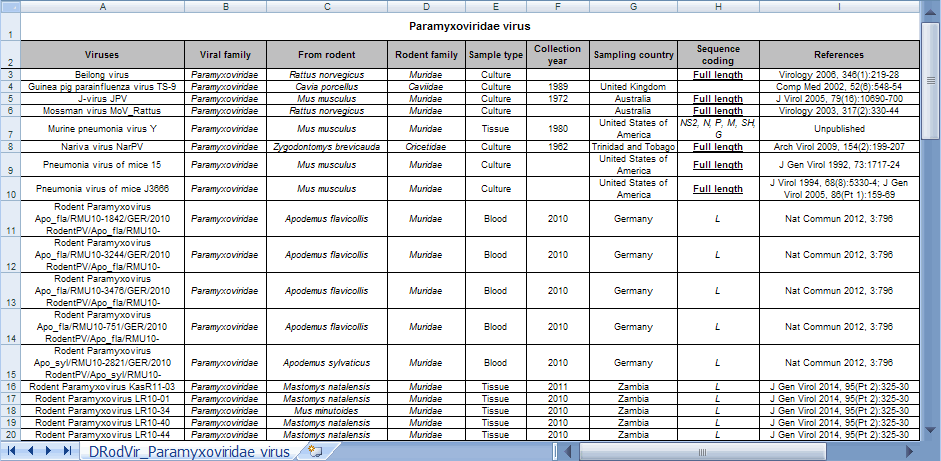
For easy further offline analyses the each information table can be saved as local Excel file using the 'Export table' button at the bottom tool bar of the main content panel. Please note that the saved file contains the same as shown in the current table in web page, so hidden columns or lines been filtered out will not be exported into the Excel file.
 |
 |
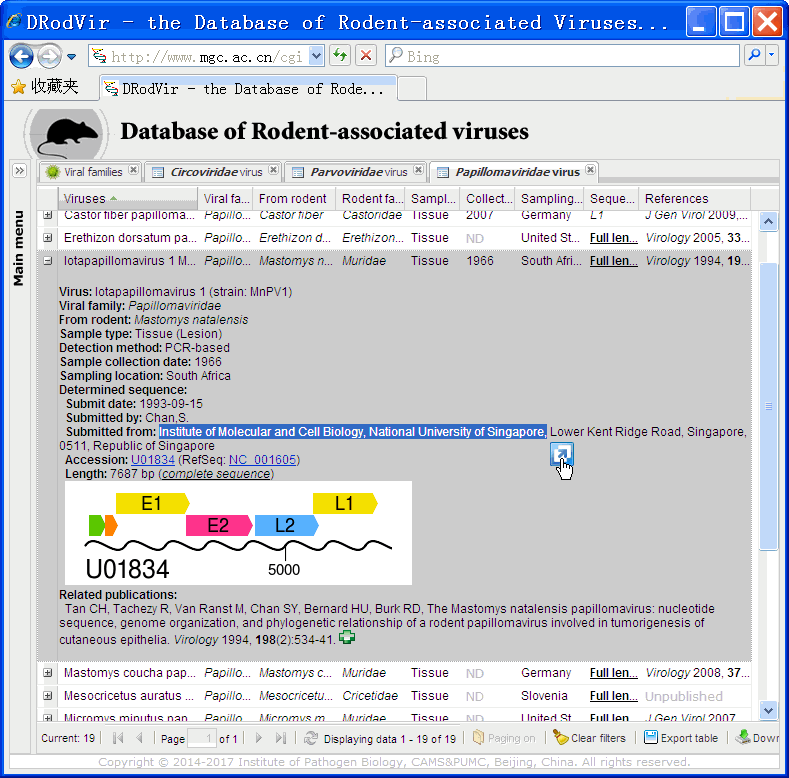
Our programs INDEED allow any users to select and copy any part of the detailed information from the table (i.e. after the line is expanded by double click or single click on the leading "+" icon), and it works well in Microsoft IE. However, due to the incompatibility of different web browsers, the select and copy function is known to be disabled by some other browsers including Chrome and Safari. So users are suggested to use Microsoft IE if they want to copy the information. We are sorry for the incontinence.
 |
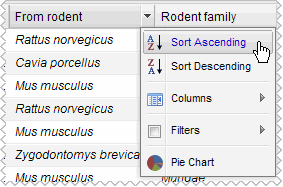
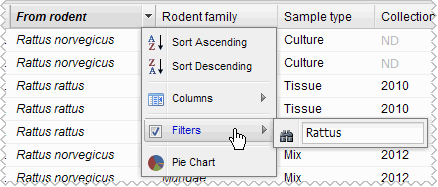
We used the ExtJS cross-browser JavaScript library to provide a highly intuitive and responsive user interface, so the information table is fully sortable and filterable. To sort the table using certain column values ascendingly users can single click the column title. Click the column title again will change to sort the table by the column values descendingly. To filter the table by certain column values users need to mouse over the column title first, and then click the arrow at the right ride of this column title, and select the 'Filters' item in the appeared menu. Input key words or select sub-items in pop-up submenu to set filtering. Please note that to remove pre-set filters in the table, users need to click the 'Click filters' button on the bottom tool bar of the main content panel.
 |
 |
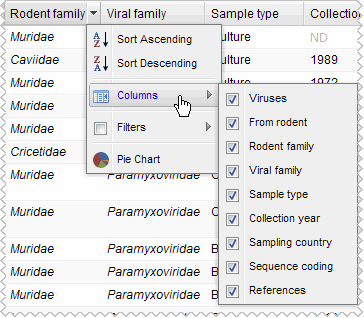
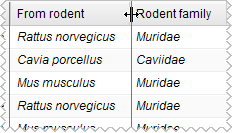
We used the ExtJS cross-browser JavaScript library to provide a highly intuitive and responsive user interface, so the information table is highly configurable. Each column in the table can be easily moved by clicking the column title, then dragging and dropping it at the required position. To hide or show some columns, users can mouse over the column title first, and then click the arrow at the right ride of this column title, and select the 'Columns' item in the appeared menu, then check/uncheck the columns in the list to show/hide the respective columns. To adjust the column width, users should mouse over the right end of the column title and the cursor will change to the style for width adjustment, then click down and drag it to the required width and release.
 |
 |
 |
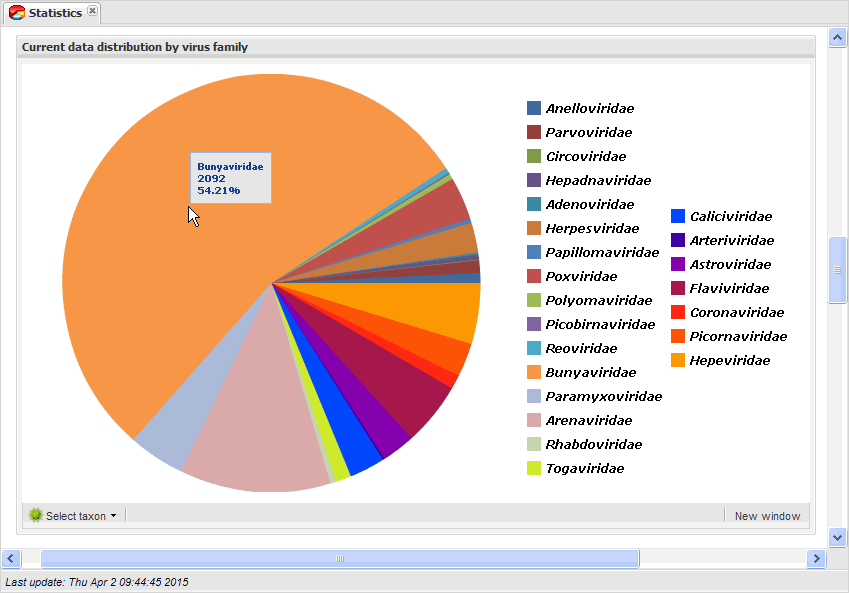
Single click the 'Data statistics' icon on the Home page or the 'Data statistics' button on the bottom toolbar of menu panel will bring a new Tab showing the current statistical charts of all data in the database, including rodent-associated viruses sequences available in GenBank each year, publications report rodent-associated viruses sequences in PubMed each year, and a set of interesting pie charts. These statistic charts are based on live data in the backgroud database, and the data last update time is showed on the bottom toolbar of this Tab. Please note that all pie charts have a configure button on the bottom left corner for setting different region/family/diet etc.
 |
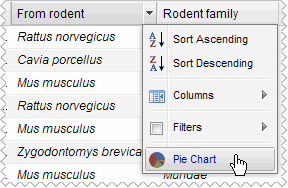
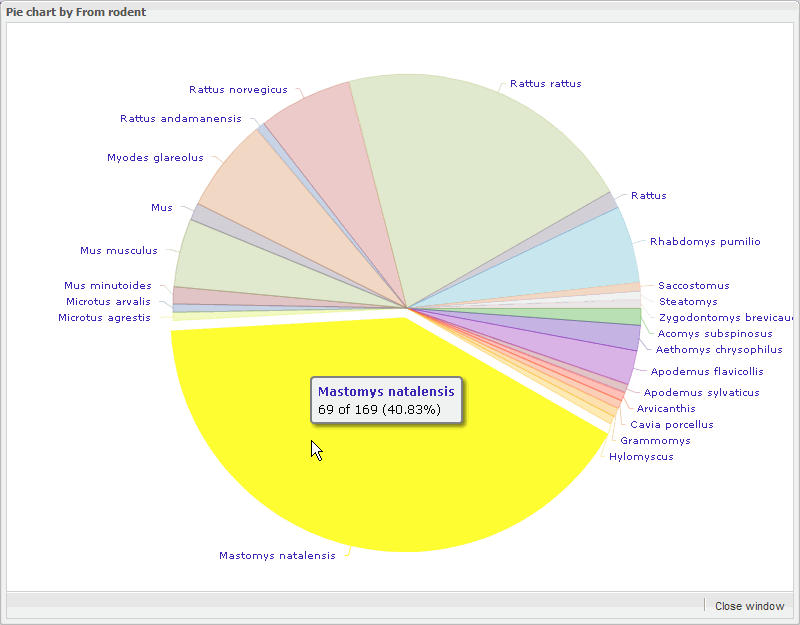
The aforementioned statistical charts are designed for ALL data in the database. For easy analyses each information table allows users to make customized statistical charts on some columns, including viral family, rodent species, rodent diet type, rodent family, sample type, and sampling country. Users need to mouse over these columns title first and click the arrow at the right ride of the column title, then click the 'Pie chart' item in the appeared menu. So a pop up window with an animated pie chart of the column values will be presented. Users can mouse over each piece to view details of the information. Please note that the pie chart includes ONLY the lines shown in the current table. So if filter or paging exists in the table the pie chart displayed would not include the lines been filtered out or not shown this page. Thus, make sure to clear filters and turn off the paging setting if users hope to make statistical charts on full dataset.
 |
 |
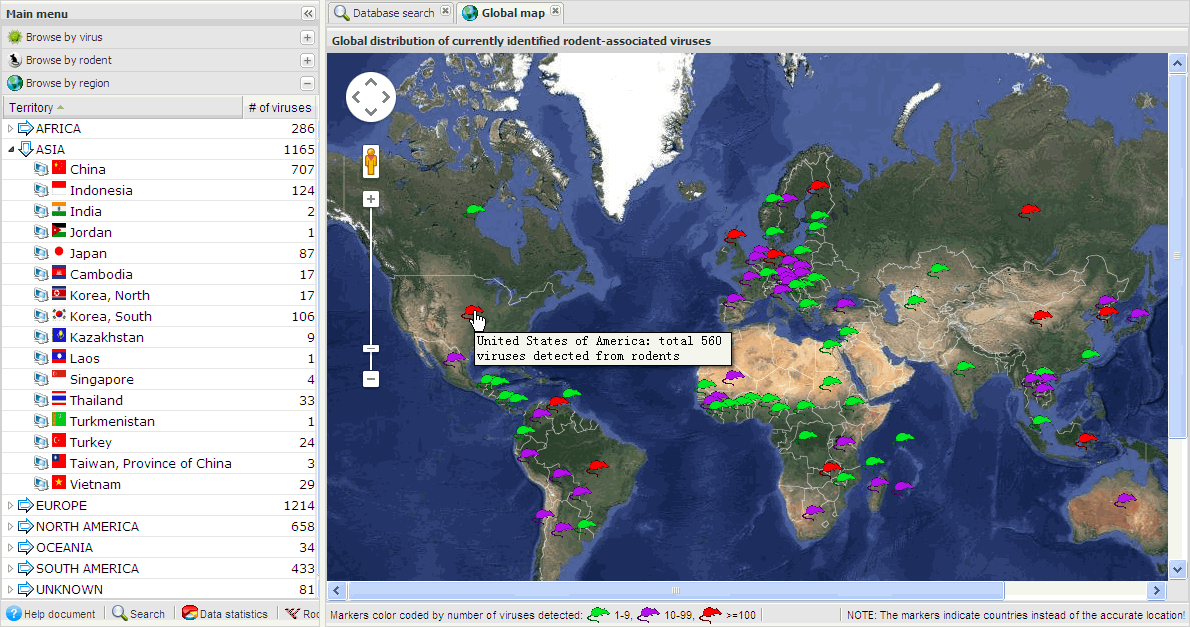
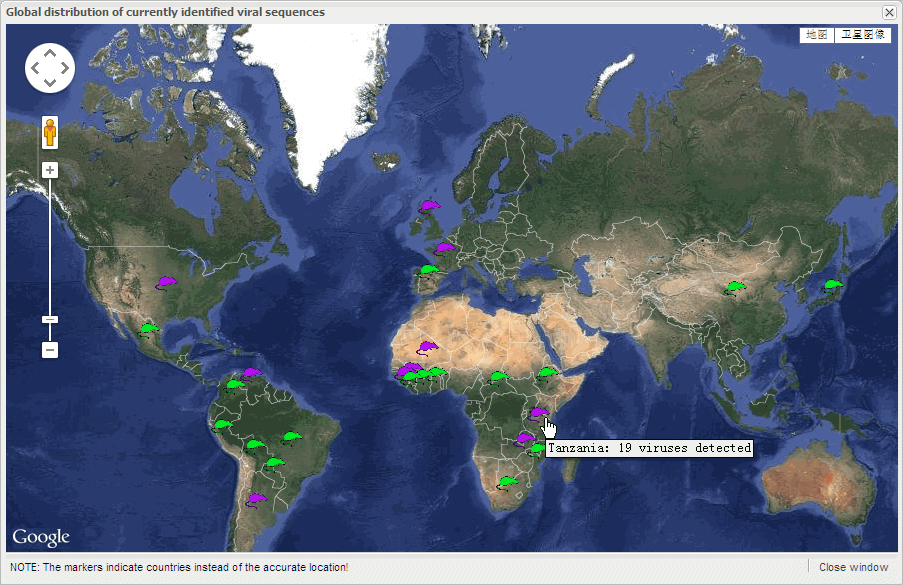
For convenient regional rodent-associated virus analyses, a submenu with a geographic category organized by continents and countries is provided in the menu panel. Single click the 'Browse' menu on the top of the Home page and then click the 'Browse by region' submenu title in the left menu panel to expand the submenu along with a 'Global map' Tab showing a Google map with markers color coded by number of rodent-associated viruses detected in each country. Please note that the markers indicate countries only instead of the accurate location.
| |||
 |
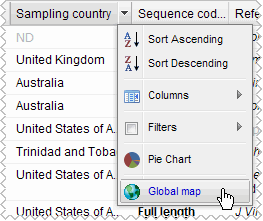
After opening the table of interested subset (either by browse or by search the data), users can mouse over the 'Sampling country' column title and click the arrow at the right ride of the column title, then click the 'Global map' item in the appeared menu to view the Google map with markers indicating the distributed countries of listed sequences. Please note that it shows the distribution of ONLY the lines shown in the current table. So if filter or paging exists in the table the distribution map displayed would not include the lines been filtered out or not shown in the page. Thus, make sure to clear filters and turn off the paging setting if users hope to make statistical charts on full dataset.
 |
 |
For easy navigation the multifunctional menu panel is shown on the left side by default (it will automatically be collapsed into a clickable vertical bar in client with relatively low screen resolution). For maximize the visible region of the main content panel users can easily collapse the menu panel into a vertical bar by clicking the double-arrow icon on the top right of the menu panel. To restore the menu panel users can single click the double-arrow icon on the top of the vertical bar.
 |
 |
The main content panel can contain many different Tab windows. Each information table the users visited is an independent Tab in the content panel, and they won't be lost unless the users close the current web page or the individual Tab in purpose. So the easiest way to go back to the Tabs the users just visited is to click the respective Tab name on the top of the main content. Thus the required Tab will go to the front of all opened Tabs and the contents will not need to be reloaded.
Please feel free to contact Dr. Jian Yang for any further questions or comments about the database.
